 gridfaro
Inventory & operations · Independent demonstration
A clearer view of stock & sales
Multi-location stock, purchases and sales, brought into one connected view.
The business problem
A clearer way
to manage the details.
Stock spread across locations makes it hard to know what is available, what is selling and what needs reordering.
What’s inside
- Stock by location, purchases and transfers
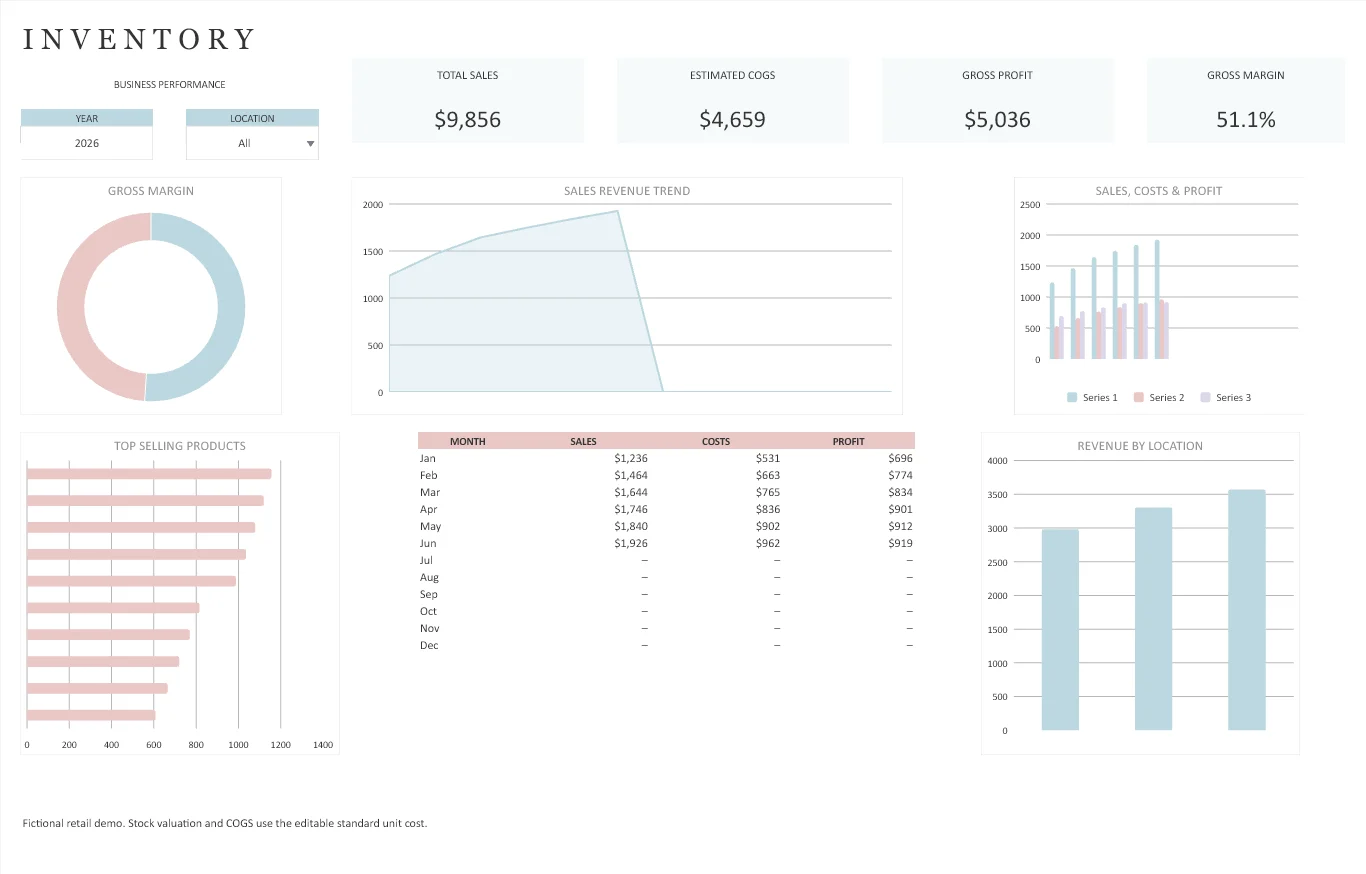
- Sales, estimated cost of goods and gross profit
- Low-stock flags and product revenue rankings
- Year and location controls
Connected, not static.
The workbook uses linked records, formulas and reports. Relevant input changes flow through its calculations. Scope and automation for a custom version are agreed separately.
The editable master is private. This page shows a screenshot of the demonstration.
A better way to work
Your business has a workflow.
Let’s give it a better system.
Tell us what you track, what takes too long, and what you wish your spreadsheet could do.